
Summary
The US-led global economy has had mixed success in seeing the benefits of technological change spread to less developed economies since World War II. Significant parts of Asia have taken off and, in some cases, caught up with advanced economies. On the other hand, sub-Saharan Africa only recently surpassed its previous per capita GDP peak of the 1970s; Latin America’s trajectory has also been meagre: It underwent two decades of low growth until the 2000s; and most of the 15 successor states of the USSR have performed exceptionally poorly, except for the Baltic states and certain Eastern European countries formerly part of the Soviet Bloc.
Credits
Author
- Ilan Strauss
Co-directors
- Mishaal Al Gergawi
- Afshin Molavi
Additional research
- Aruba Khalid
- Rick Twelves
Design and graphics
- Shilka Kunhimon
- Farah Jdid
- Khadija Toor
- Gayoung Lee
Editing
- Karla Green
- Zaineb Al Hassani
- Omar Shariff
Production
- Diala Dabbas
- Marri Janeka
Web development
- Savvy, Inc.

Part I - Introduction: Key Themes
What have been the major changes in the global economy since World War II? Have emerging markets ‘risen’, and will their ‘rise’ become more widespread? This report details where the world economy is today in terms of the inequality between nations (section 2), how we arrived at this situation (section 3), and where this might take emerging markets in the future (section 4).
The three most important trends for emerging markets post-WWII have been:
- Increasing global economic integration and the spread of capital;
- The rise of emerging Asia; and
- The fall of communism.
1.1. Increasing global economic integration and the spread of capital
The history of economic growth and development is, in a sense, a history of the spread of capital worldwide: Its technology, ideas, and imperatives. Much of this report, therefore, focuses on the historical factors that facilitated the spread of capital, in particular, the creation of the world market with the fall of communism and the removal of barriers to the free flow of the factors of production under the watch of the US.
The rise of capitalism has brought with it unprecedented advances in human development. At its core, such phenomenal developments have been driven by technological change: The use of more productive techniques, skills, and processes to produce goods and services. This means we can meet more of our needs than ever before while using far less effort, time, and resources. Since technology is embodied in machinery and productive capability, economic backwardness is a backwardness of production. For example, as recently as 1990, India’s capital and output per worker were on par with 1820s Britain.
This report briefly discusses why some countries have benefitted from the growing spread and availability of capital while others have not. Ultimately, a nation’s ability to fully exploit new technologies and foreign capital requires a coherent and co-ordinated set of ‘industrial policies’ to diversify production and increase domestic value added. On their own, markets tend to reinforce pre-existing areas of national comparative advantage rather than create new ones.
1.2. Rise of emerging Asia

Asia’s first world expo was held in Furukawa Pavilion, Osaka, Japan in 1970, signalling the country’s resurgence following World War II. m-louis/Flickr CC BY-SA 2.0
The historical record is one of rich countries becoming richer, while the majority remain relatively underdeveloped. The catch-up of countries in East Asia since 1950 is a notable exception. This rise began with Japan in the period following WWII until 1990 and was followed by the ‘Asian Tigers’ (South Korea, Taiwan, Hong Kong, and Singapore) from the 1960s onwards. The catch-up continues today with the rise of India, China, and a second tier of Asian countries that includes Thailand, Malaysia, Vietnam, and Indonesia. Since 2000, South Asia’s poorest countries have also begun to show potentially meaningful economic acceleration.
As a result, an increasing proportion of people in the world are catching up with the West – more so than at any other point in history – owing to developing Asia’s large population. However, inequality within countries is at unsustainable levels and serves as an important qualifier against the notion that catch-up implies a uniform welfare impact.
1.3. Fall of communism
The other major change in the global economy has been the fall of communism. The Cold War was a boon for parts of Asia and Europe due to US willingness to share technology and ideas. For others, however, it resulted in proxy wars. It created barriers to the world market for 46 countries, or regions, where communism was implemented. It also reduced the West’s willingness to share ideas and technology. On the other hand, the fall of communism in 44 of those places led to a rise in their long-term growth possibilities and a precipitous expansion of the world market.

Part II - The Rise of Emerging Markets
This section provides a brief overview of the ‘who’, ‘what’, and ‘why’ of the rise in emerging markets.
As a collective, emerging markets are rising: We are slowly seeing more economic activity shift towards them, with the GDP of emerging markets overtaking developed economies, starting in 2005 in PPP terms (see Figure 1) and in 2010 using market exchange rates. Emerging markets’ share of world GDP increased by almost 50% between 1990 and 2015, in PPP terms.
Figure 1: Emerging vs Developed Economies’ Share of World GDP (PPP, %)

Sources: The Economist, IMF, World Trade Organisation, the World Bank, UN Conference on Trade and Development, BP, 2016
Note: Based on 1990 data, developed economies are defined as: Australia, Austria, Belgium, Canada, Denmark, Finland, France, Germany, Greece, Iceland, Ireland, Italy, Japan, Luxembourg, the Netherlands, New Zealand, Norway, Portugal, Spain, Sweden, Switzerland, the UK, and the US. Emerging economies comprise all others.
Emerging markets have risen to prominence across a host of indicators over the past two to three decades (Figure 2). In 2014, emerging markets accounted for more than half of the world’s household consumption, exports, oil consumption, and inflows of foreign direct investment (FDI). Emerging economies also accounted for more than 40% of the world’s outward FDI and investment (‘fixed capital formation’) in 2014. They still trailed advanced economies in terms of financial development and commerce (‘market capitalisation’ in Figure 2) but are catching up fast. Almost one-quarter of Fortune Global 500 corporations came from emerging markets in 2010; compared to only 4% in 1995.
Figure 2: Emerging Economies, World Share by Year (%)
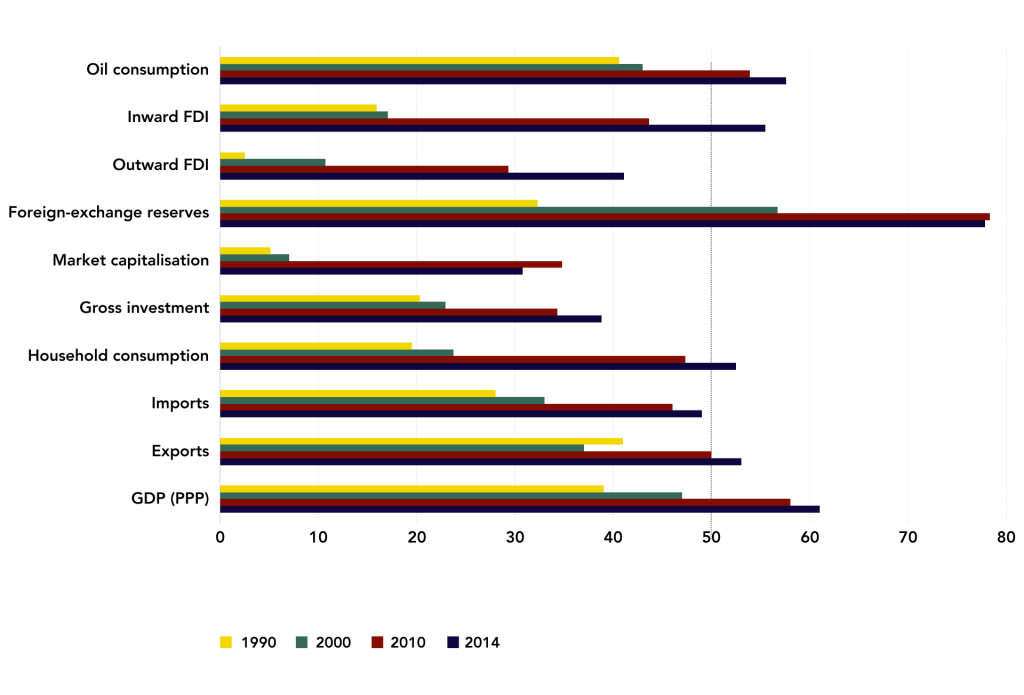
Sources: The Economist, IMF, World Trade Organisation, the World Bank, UN Conference on Trade and Development, BP, 2016
Note: See accompanying note for Figure 1 above.
The rise of emerging markets, in particular in Asia, has seen the creation of an ‘emerging global middle class’, labelled as such because, relative to the middle classes in advanced economies, they are still poor. For roughly 20% of the global population, ranging from the 40th to 60th global percentile (the y-axis of Figure 3), large relative income gains occurred over the past two decades (point A, Figure 3). This is the ‘emerging’ global middle class. At the same time, the lower-middle classes in advanced economies have seen their incomes stagnate (point B, Figure 3). This has gone hand-in-hand with the remarkable rise of the global elite, which saw large absolute and relative income gains (point C, Figure 3).
Figure 3: Relative Cumulative Gain in Real Per Capita Income by Global Income Level, 1988-2008 (%)
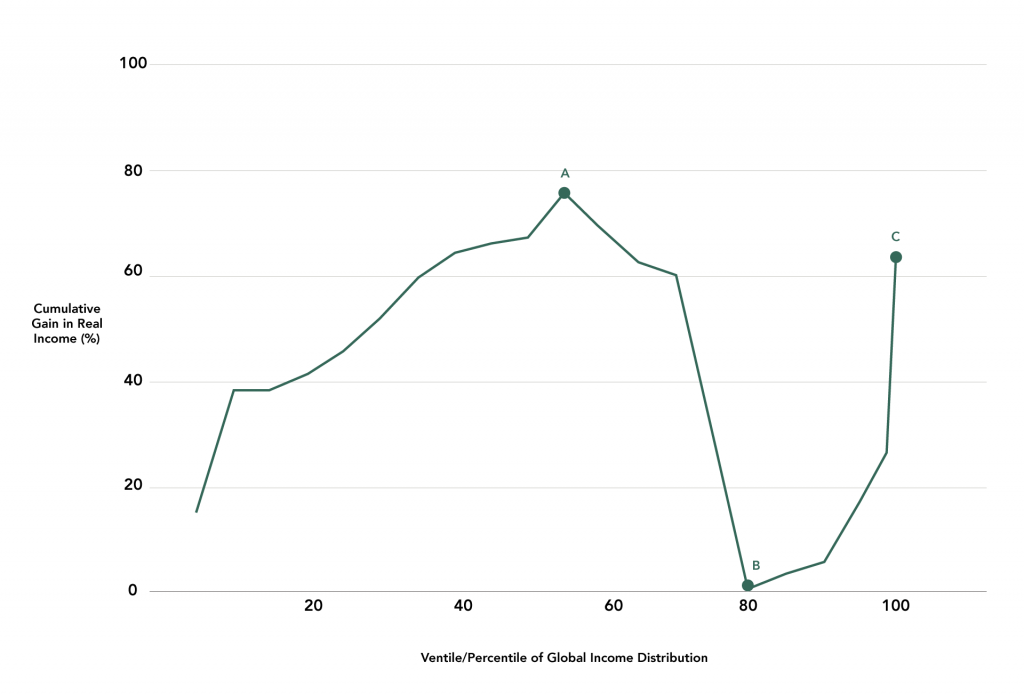
Source: B. Milanovic, 2016
Nine out of 10 people in the global middle class (around point A, Figure 3) are from Asian countries and earn US$5-15 per day. Given its large population, China has been central to this trend. Since the 1990s, it has played an overwhelming role in driving emerging market growth and advancing the shift in economic gravity away from the West.
There are several facets to China’s rise:
1. China is a significant source of global FDI. In 2014, its outward FDI overtook its inward FDI for the first time. It is the largest emerging market foreign direct investor and ranks third globally after the US and Japan.
2. China is a major source of international finance. The ready availability of large amounts of concessional Chinese financing has weakened the relevance of the World Bank and the IMF and their influence over developing economies. By the end of 2014, the China Development Bank (CDB) and Export-Import Bank of China had loaned about $684bn, just short of the $700bn owed to the six major, Western-backed, multilateral development institutions. By the end of 2014, the CDB had overtaken the World Bank as the world’s largest provider of development finance. China’s involvement has doubled the availability of development financing over the past decade. This financial clout is translating into institutional power: In 2014, China led the establishment of the New Development Bank, the Asian Infrastructure Investment Bank, and the Silk Road Fund.
3. China is a major source of global demand. In 2015 nominal terms, its GDP was equal to more than half the EU’s GDP, and more than that of Japan, Germany, and the UK combined.1 In 2014, China accounted for 10% of global merchandise imports and 12% of global merchandise exports, in gross value-added terms. It was the leading global merchandise exporter and second-largest global merchandise importer after the US in 2014.
4. China is an emerging source of global innovation and new production technologies. Much of China’s exports rely on more sophisticated imported intermediate inputs. But China is also becoming a source of innovation. Its patent applications have risen 30-fold this century, mainly in computing and digital communications. However, it still trails the US in terms of the quality of its research and patents.
China’s less risk averse nature, unconditional foreign economic engagements, middling stage of economic development, large demand for natural resources, and growing political competition with the West help explain why its rise has, on aggregate, been particularly beneficial to other emerging markets.
2.1. Which emerging markets have risen?
The overall historical record is one of rich countries becoming richer while the majority remain in a relatively underdeveloped position (Figures 4 and 5). This is true post-WWII. The only continent to have significantly caught up with the West between 1952 and 2008 is Asia, and in particular parts of East Asia (Figure 4). On the other hand, Africa and Latin America showed meagre growth during this period: They grew below the dotted horizontal line marking the growth rate of the market leader, the US, indicating growing divergence from the US. Eastern Europe, West Asia, and the Caribbean all grew above the US but generally not by much, indicating extremely gradual convergence. And small differences in annual growth rates make a big difference to catch-up prospects. For example, it would take sub-Saharan Africa 126 years to overtake US GDP if it grew at 4% per annum and the US grew at 2%; while only 64 years if it grew at 6% per annum, all else equal.2
Figure 4: Cumulative GDP Per Capita Continent Growth, 1952-2008
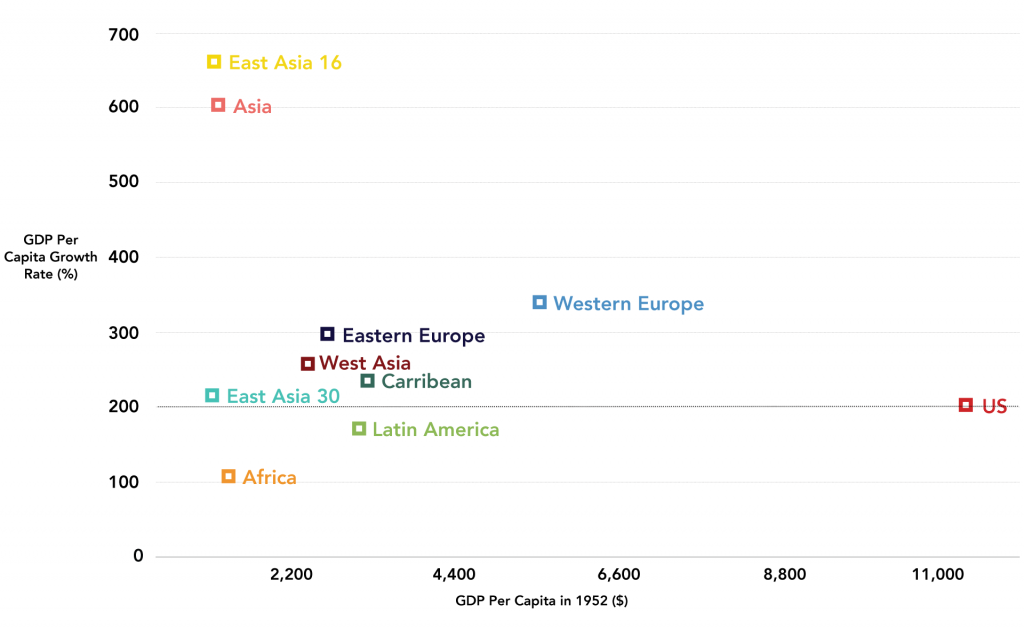
Source: I. Strauss, 2016 (based on data from the Maddison Project)
Notes: The y-axis is logged. Figure is in PPP 1990 international GK$. To see exactly which countries are included in each category, see ‘historical statistics’ in the original data.
The picture of growing divergence between the US and non-Asian emerging markets is reflected at the country level, too (Figure 5). Countries that were poorest in 1952 (the left side of the x-axis) should have grown the quickest, but, in general, this has not been the case. Only 29 countries grew at double the rate of the US during the period 1952-2008 (what we call ‘rapid’ catch-up). These are the labelled points on the graph. The dotted horizontal line again marks the growth rate of the US, the market leader. Countries that fell below this line were diverging from the US (75 in total) during this period, while those that sat above it (70 in total) were converging, however slowly.
Figure 5: Cumulative GDP Per Capita Country Growth, 1952-2008
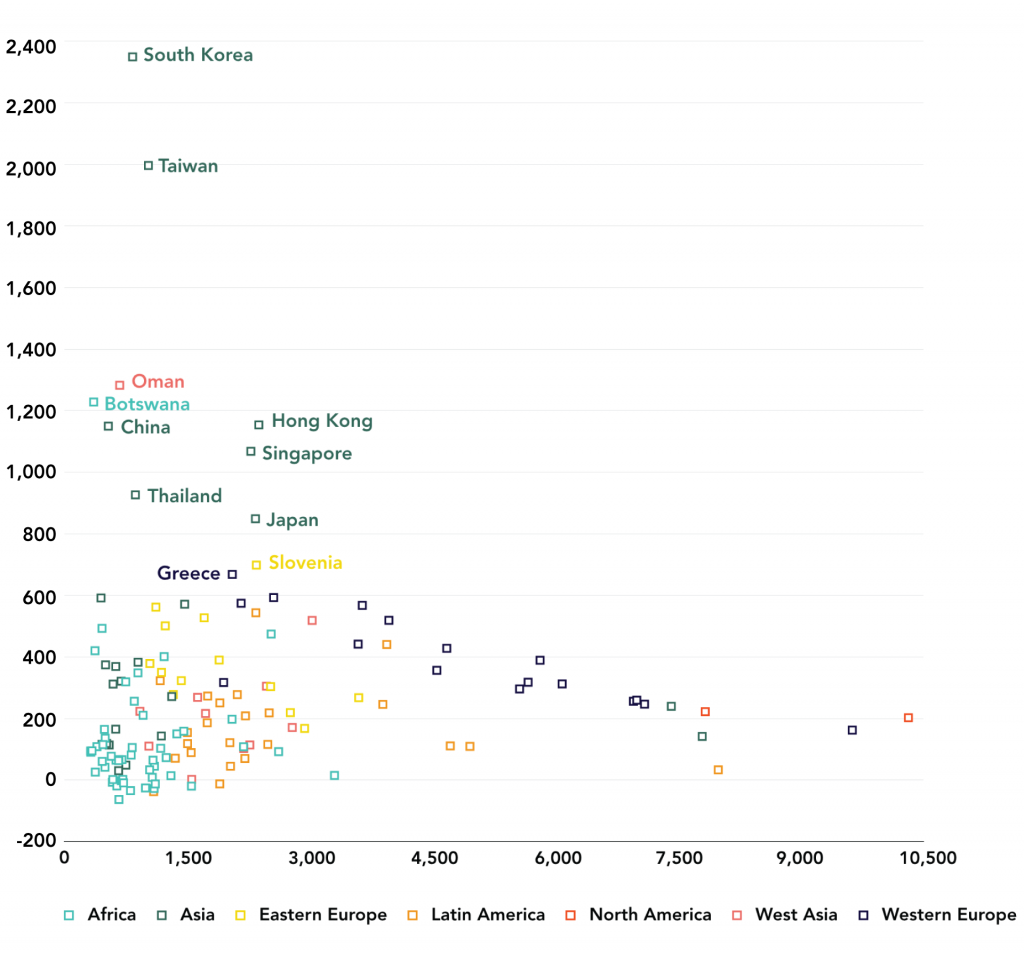
Source: I. Strauss, 2016 (based on data from the Maddison Project).
Notes: Using PPP 1990 international GK$. Only countries with more than double the growth of the US are labelled. Countries of the former Yugoslavia were analysed separately. The fifteen republics of the USSR were studied as one entity rather than individually. The latter will bias statistics towards convergence. We do not include Equatorial Guinea, an outlier, which saw cumulative GDP per capita growth of about 37% during this period.
In the decades immediately following WWII, significant and widespread convergence between countries occurred globally. Between 1952 and 1973, catch-up with US GDP per capita occurred for 95 countries, and ‘rapid’ catch-up for 40 countries. Only five countries experienced negative per capita growth, i.e. a shrinking in output per person.
This pattern reversed dramatically from the 1970s until about 2000. Rich countries become richer relative to most underdeveloped countries, except for a group of Asian countries that caught up significantly. Between 1973 and 1990, almost one-third (57 countries) of our sample saw negative GDP per capita growth, and only 12 countries experienced ‘rapid’ catch-up. This dire situation for emerging markets continued into the 1990s: Between 1990 and 2000, 60 countries experienced negative GDP per capita growth, although 17 countries – largely emerging markets – experienced ‘rapid’ catch-up.
The loss of momentum in economic growth from the late 1970s until 2000 was sharp across Africa, Latin America, and Eastern Europe. Russia’s per capita GDP declined by more than 40% between 1989 and 1998, while Brazil’s GDP per capita in 2000 was barely above its 1980 level. Africa fared even worse. Its real GDP per capita in 2000 was 20% below its 1980 level. For a notable portion of African countries, the last half century or so has been a write-off: GDP per capita levels in Madagascar and the Republic of the Congo are similar to those of 80-90 years ago, while Zambia and Zimbabwe are only marginally better. Similarly, Nigeria’s GDP per capita was higher in 1970 than in 2003. The list goes on, illustrating that what we are witnessing is a recovery of Africa.
Until 2000, Africa was burdened by debt, the collapse of the commodity cycle, and civil wars. In contrast, rich countries fared well during this period, growing by about 2% per year, such that by 2000 their GDP per capita was 50% higher than in 1980.
How do we square such dismal emerging market growth performance since the 1970s with the seemingly inexorable relative shift in economic activity away from the West and towards developing economies?
- The 2002-12 commodity price boom: On the back of China’s rapid growth, commodity prices rose dramatically during this period. This so-called commodity super cycle led to rapid convergence between advanced economies and emerging markets, which grew 6% per year – their highest rate in any 10-year period over the past four decades. Between 2000 and 2008, an unprecedented 118 countries saw ‘rapid’ convergence with the US in per capita terms, though 15 still saw negative per capita growth. However, with the fall in commodity prices and the end of this price cycle, emerging market growth is projected to be just 0.4% in 2016, delaying further convergence by decades. This pattern is in line with the boom and bust historical growth cycle of developing economies, two-thirds of which are commodity dependent.
- More people are ‘catching up’: Even if most countries are being left behind, more people than ever before are catching up with the living standards of wealthy countries. This is due to notable economic growth in the populous nations of China, India, and emerging Asia. This means that inequality between countries has declined since 1980 if we weight each country according to its population size (‘country-weighted’ convergence). This trend should only increase as relatively more people are born in Asia: By 2025, about two-thirds of the world’s population will live in Asia.
- Large expansion in public investment and more favourable geopolitical conditions: The commodity boom overlapped with other favourable changes in the poorest economies in Africa and elsewhere, including a decline in civil wars, improved governance, greater expenditure on health and education as debts fell, lower inequality, and better macroeconomic stability. However, progress has become increasingly uneven.
- Convergence in well-being: Poorer countries are gradually catching up with their richer counterparts across a number of non-economic indicators. As technology spreads, violent conflicts are resolved, governments become more effective, and public health interventions expand, people are generally living better and longer lives. The gains have, however, been extremely uneven, especially in Africa.
Life expectancy has increased over the past few decades in sub-Saharan Africa, though not continuously. For many African countries, the trend towards higher life expectancy was delayed by debt, austerity, civil war, and low commodity prices. Zambia, the Republic of the Congo, Kenya, Nigeria, and many others all saw life expectancy stagnate and, until recently, even decline. Between 1960 and 1985, life expectancy in sub-Saharan Africa increased from 40 years to 49.5 years. The following 15 years saw no movement.
However, from 2000 to 2014, life expectancy accelerated sharply from 50.3 years to 58.4 years. This rise has been attributed to improved HIV/AIDS treatment, an increase in interventions to r educe child mortality, more external private health funding, a reduction in violent conflicts, and debt write-offs – the latter of which facilitated expenditure switching. Other regions have experienced a more consistent rise in standards of living over the past several decades, despite times when GDP per capita stagnated. Convergence is also true for other multidimensional, non-economic indicators.
Across a range of non-economic indicators, people throughout the world are, however unevenly, gaining access to similar necessities: Convergence is taking place among those with access to sanitation facilities and improved water sources, those who are nourished, and internet users as a percentage of the population. Convergence can also be seen in literacy rates, inflation rates, and under-five mortality rates. Progress is not uniform, though: For other indicators, such as health expenditure per capita, divergence continues. Sub-Saharan Africa shows little progress compared to other regions on a number of other non-economic measures, too.

The Masaika Clinic, situated in the Tanga region of Tanzania, serves more than 1,800 people. There are on average 2.3 physicians per 1,000 people in Africa. Medical facilities such as the Masaika Clinic are especially critical in rural areas. January 25, 2008. US Army Africa/Flickr CC BY 2.0
As a result of these positive forces, between 1952 and 2008, 22 non-Western countries saw ‘rapid’ catch-up with the US, defined as more than twice US GDP per capita growth (Figure 6). Most of these came from Asia (nine – the Asian Tigers, Thailand, Malaysia, Myanmar, and China); followed by Africa (five – Botswana, Lesotho, Cape Verde, Equatorial Guinea, and Mauritius); Eastern Europe (four – Slovenia, Montenegro, Serbia, and Croatia); Latin America (two – Trinidad and Tobago, and Puerto Rico); and West Asia (two – Oman and Israel). ‘Normal’ catch-up, defined as growing quicker than the US, was more widespread: 53 non-Western countries saw this slower catch-up (Figure 6).
Figure 6: Catch-up and Rapid Catch-up by Region (number of countries), 1952-2008
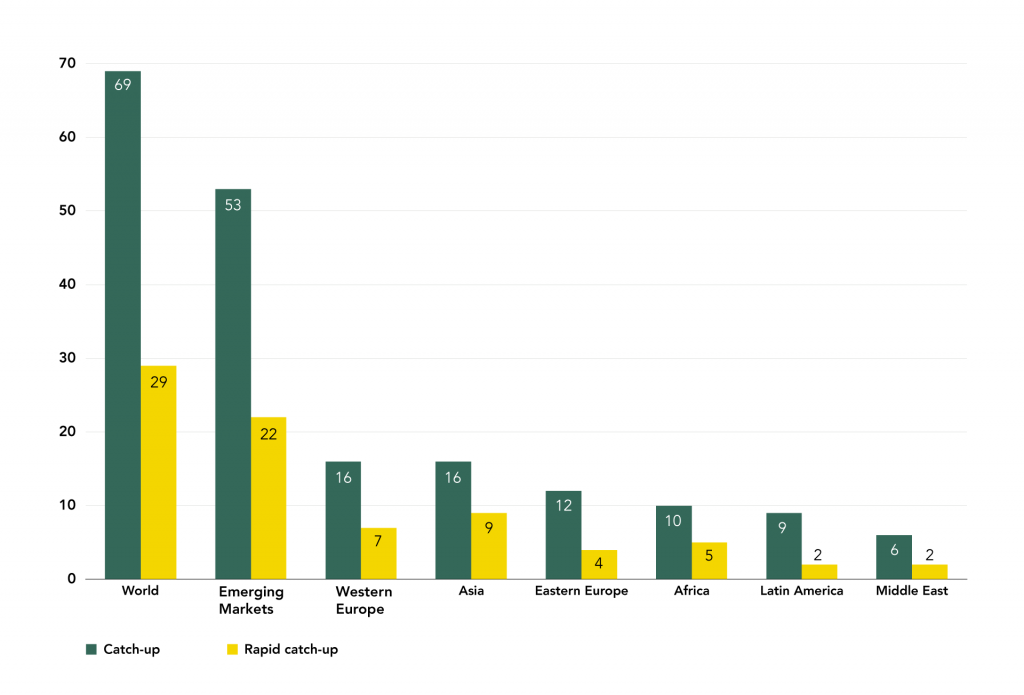
Source: I. Strauss, 2016 (based on data from the Maddison Project)
2.2. Why and how have emerging markets risen?
Emerging markets have risen because they have managed to take advantage of the growing spread of capital, including its technologies, ideas, financial resources, and management techniques. Technology plays a central role in catch-up. It allows countries to begin their economic development from a much more advanced stage and integrates markets by reducing the cost of distance and other barriers facing more isolated economies. Technology also facilitates a growing international division of labour as production becomes more modular and tasks can be clearly separated and offshored.
As technology continues to advance, the period in which substantial improvements in output and living standards can occur has shortened dramatically (Figure 7). In turn, this has increased the importance of assimilating foreign ideas, technology, and global expertise, and has made inward-looking development strategies less viable.
Figure 7: Number of Years Select Countries Took to Achieve a GDP Per Capita of $5,000 from a $1,000 Threshold
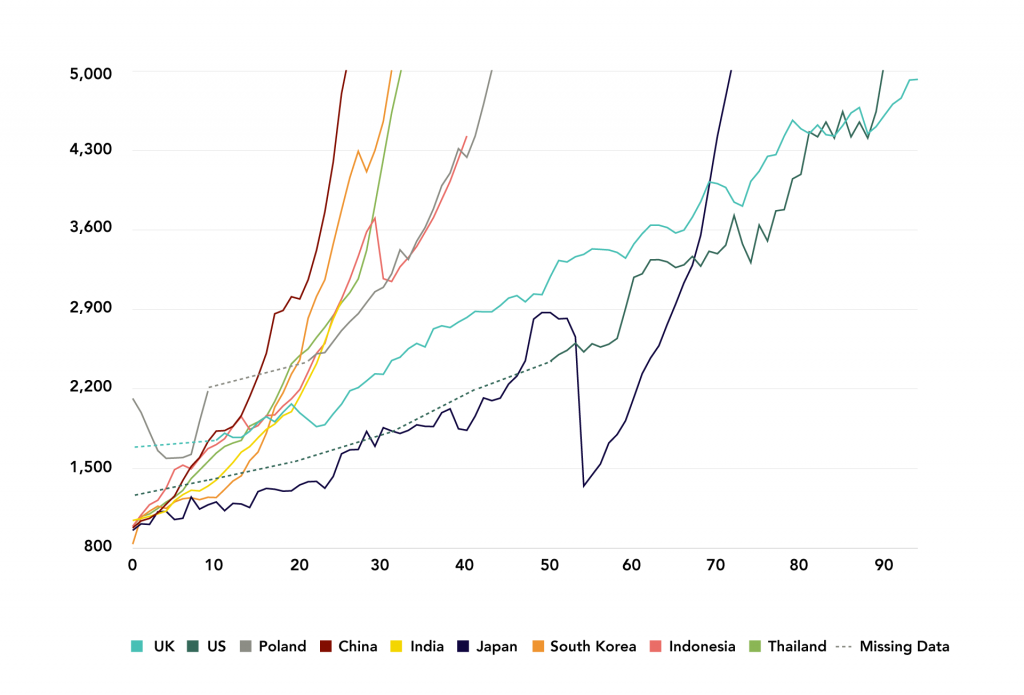
Source: The Delma Institute, 2016 (based on data from the Maddison Project)
Note: PPP 1990 international GK$. Dotted lines indicate missing data.
China has made rapid gains in a relatively short period of time, in part due to the utilisation of foreign technology and ideas to a far greater extent than any other large, latecomer industrialiser. For example, since China’s gradual integration into the world market, life expectancy in the country has increased from 63.7 years in 1978 to 76.9 years in 2015, a period of 37 years. By comparison, it took the US 50% longer, 56 years, to accomplish this same feat.
As recently as 1970, China had the same GDP per capita as India, and its relative distance with respect to the US was greater than at any point since the early 19th century, at a ratio of 20:1. This ratio is now less than 4:1 (Figure 8).
Figure 8: GDP Per Capita Catch-up between the US, China, and India, 1950-2010

Source: The Maddison Project (based on B. Milanovic, 2016)
Note: The y-axis is logged. Using PPP 1990 international GK$.
Catch-up through the assimilation of new technologies and management techniques has never been an automatic market-driven process; instead, it requires state co-ordinated ‘industrial policies’. Such policies were central to the emergence of not just the East Asian Tigers, Japan, and China, but also the industrialisation of the US, Western Europe, and Germany. The various colonies at the time, however, lacked such policy independence. Drawing from the work of leading 19th-century economist Friedrich List, these policies initially focused on creating a large national market by abolishing internal tariffs and improving transportation; erecting an external tariff to protect ‘infant industries’ from foreign (then British) competition; creating banks to stabilise the currency and provide businesses capital; and establishing mass education “to speed the adoption and invention of technology”. High rates of co-ordinated investment combined with a strong emphasis on exports and the world market underwrote this model.
However, the relevance of this model for catch-up in today’s world is in doubt, not only because it fails to address the commodity dependence of emerging markets, but also because it may be less effective under a more integrated global economy in which capital is more mobile and less restrained by the nation-state.
Technology is also vital in helping to ameliorate the relative advantages and disadvantages of geography. This is important since geography is a deep historical factor that has shaped the relative opportunities for industrialisation. Technology breaks down the barriers of time and space that separate national economies, allowing capital to spread to underdeveloped, previously isolated, nations, thereby facilitating catch-up (as with North America). But integrating markets and reducing the costs of international trade also brings countries into more serious competition with each other, leading to larger regional economic divergences (as with North America vs South America), and larger global divergences (as with the underdevelopment and de-industrialisation of the ‘Third World’ in the 19th century).
Declining transport and communication costs have also played a major role in reducing the importance of ‘good’ geography. Between 1920 and 1990, the average ocean freight and port charges for US cargo fell more than 70%, while the average air travel fare per passenger mile fell 84% between 1930 and 1990. The cost of a three-minute phone call between New York and London dropped from $300 in 1930 to $1 in 1997. However, such innovations have not removed the continued importance of geography in shaping countries’ contrasting development opportunities and trajectories.
It still costs several times more to ship a tonne of cargo by land than by sea, which is why being accessible to oceangoing ships, or being located on the coast or a navigable river, provides some nations with inherent advantages. Possessing these qualities, says US scientist Jared Diamond,
“ … puts landlocked countries at an economic disadvantage, and helps explain why landlocked Bolivia and semi-landlocked Paraguay are the poorest countries of South America. It also helps explain why Africa, with no river navigable to the sea for hundreds of miles except the Nile, and with 15 landlocked nations, is the poorest continent. Eleven of those 15 landlocked African nations have average incomes of $600 or less; only two countries outside Africa (Afghanistan and Nepal, both also landlocked) are as poor”.
But the disadvantages of geography are not exclusively concerned with higher transport costs. Much development aid has gone into dealing with the significant natural disadvantages accorded to tropical regions.
Today in Africa and the Americas, tropical countries are on average far poorer than their temperate cousins. This is primarily due to the impact of geography on agricultural productivity and diseases:
1. Tropical diseases are unrelenting, diverse, widespread, and biologically less prone to the development of vaccines. The impact on labour productivity is considerable.
2. Lower agricultural productivity in tropical areas, arising from a confluence of factors, has historically meant that surplus produce for reinvestment was lacking.3 This, in turn, limited the rise of more complex institutions and productive capabilities.

Part III - Growth and Development Since WWII
This section provides a partial overview of the spread of capital under Pax Americana – the relatively stable international world order under the US since WWII. This period in history can be divided into three stages:
1. The period between 1950 and 1973 – what is known as the ‘Golden Age of Capitalism’ – saw Japan’s rise amid unprecedented global economic growth.
2. In the second period, between 1973 and 1989, global growth slowed considerably: Africa and Latin America experienced a debt crisis, while, at the other end of the scale, the Asian Tigers grew dramatically.
3. In the third period, from 1989 until the present, communism fell, and China, India, and a second tier of emerging markets appeared. Beginning in 2000, China lifted global economic growth and drove a commodity ‘super cycle’. This collapsed partly due to internal economic adjustment in China and as a result of inadequate global demand stemming from growing inequality.4
The rise of Pax Americana has been characterised as neoliberal. Following British economist Nigel Harris, we define this as the ethics of competitive markets:
“‘Neoliberalism’ is the ideological expression of global capital, not the product of a sudden surge of greed (that was always there) or an intellectual error by economists. The neoliberals are the product of the emerging economic system, not its source.”
3.1. Growth and stability under Pax Americana
Stage I
began with the construction of the post-WWII international order under the US, and ended in 1973 as a result of oil price shocks.5
This was a period of unparalleled and widespread prosperity: World GDP per capita grew by around 3% per year, world GDP by around 5%, and exports by nearly 8%. There was considerable convergence in per capita income and productivity across the world, with all regions performing better than in any previous period and many growing quicker than the US.
Figure 9: Average Annual GDP Growth Rates by Time Period (%)
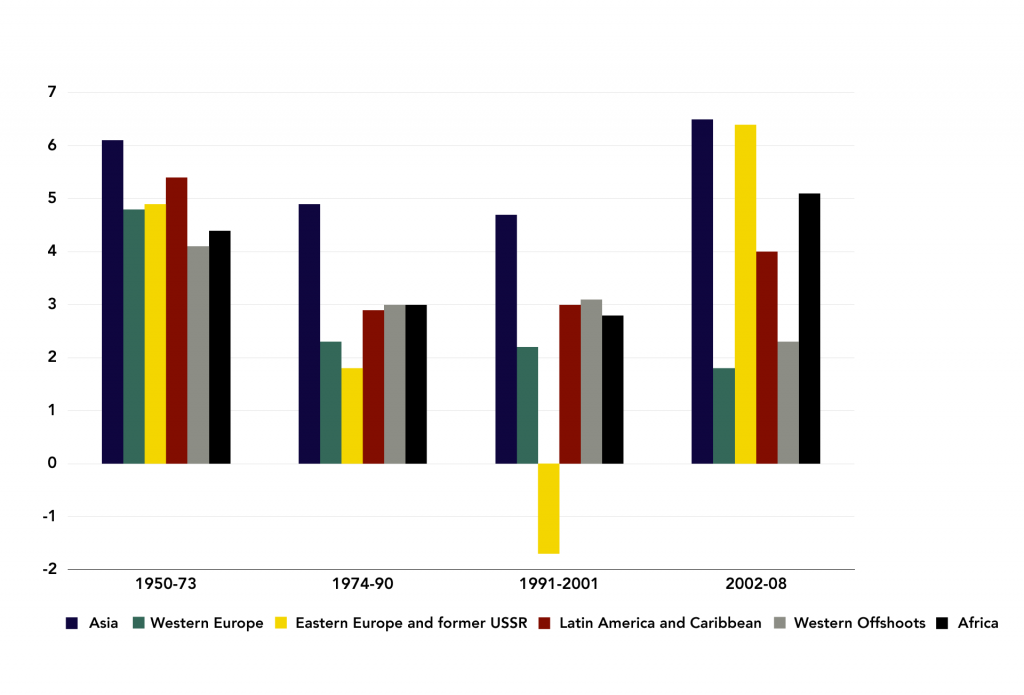
Source: A. Maddison, 2007
Note: Measured in 1990 GK$. Western offshoots include the US, Canada, Australia, and New Zealand.
Figure 10: Average Annual GDP Per Capita Growth Rates by Time Period (%)
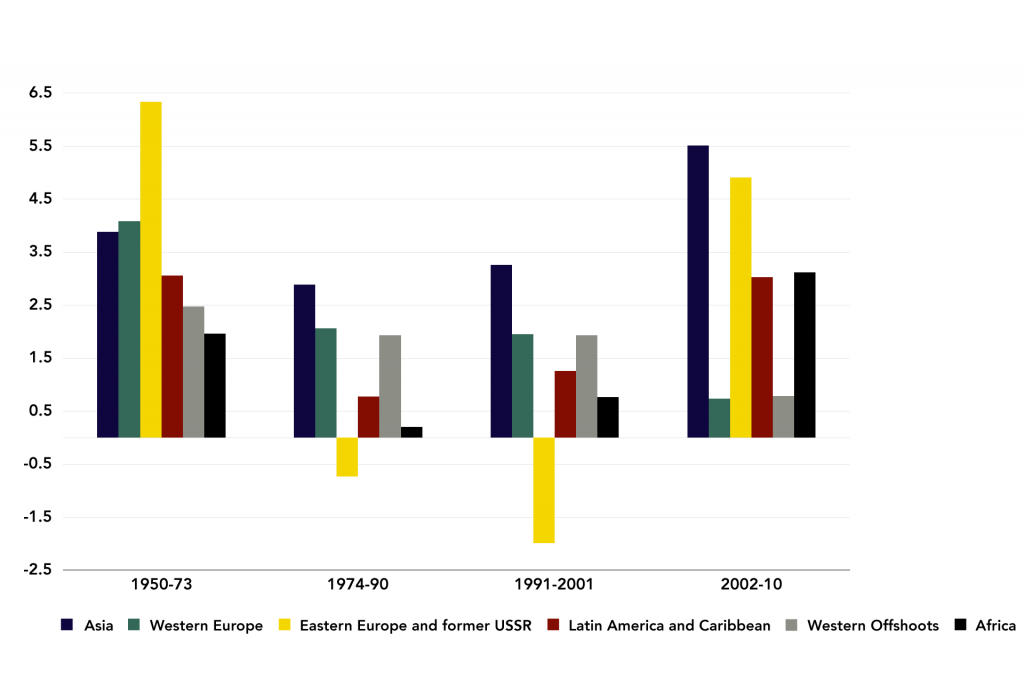
Source: A. Maddison, 2013
Note: Measured in 1990 GK$. Western offshoots include the US, Canada, Australia, and New Zealand.
World trade to GDP increased from 24.7% in 1960 to 30% in 1973, while FDI increased from 0.5% of GDP in 1980 to 1% by 1989.
Patterns of technological innovation and adoption set the stage for the ensuing rapid global growth and ‘catch-up’ of the Asian Tigers. “It was the new revolution in consumer electronics and household appliances that created special opportunities for East Asian industrialisation,” notes Harvard professor Ezra Vogel. Growth in the ‘periphery’ of Latin America and Africa was largely due to the “diffusion effects of high growth momentum in the advanced countries”, rather than extraordinary policy decisions.
While the US overtook the UK in GDP and GDP per capita in approximately 1871 and 1901, respectively, the world economy was still managed by Britain until WWII. After the war, the US dismantled the British system of colonial privileges that prevented the spread of its goods and services across the world. It then instituted its own international architecture consisting of the IMF, World Trade Organisation (WTO), and World Bank. These became known as the Bretton Woods Institutions. Their underlying approach was that adjustment was the responsibility of the debtor rather than the creditor. This would have particularly strong implications for African, and Latin American and Caribbean (LAC) countries, which, when seeking financing later, were forced to adopt deflationary policies.
The fixed gold-exchange standard was established by the Bretton Woods Institutions and underwrote the post-war period. Under this monetary regime, countries had to trade at a fixed and convertible rate to the US dollar. The US directed considerable effort towards maintaining the system by helping to ensure other countries had sufficient quantities of dollars to operate with. But, as the Triffin dilemma laid bare, it was unsustainable to use the dollar both as an international reserve currency (tied to gold) and a domestic currency for domestic US objectives. In the interim, however, the exchange rate regime was conducive to high rates of growth globally.
A regime of accumulation based on corporatism was in place in advanced economies, whereby major interest groups shared responsibility for economic decisions. This proved to be remarkably successful in facilitating high rates of economic growth. Real wages grew in line with labour productivity, and productivity growth and investment were high. Per capita GDP grew 50-100% in the US, Germany, the UK, the Netherlands, and France between 1960 and 1980. Tax rates were high and welfare expanded under Keynesian-style deficit spending. This ‘regime’ engaged in a division of labour far less global than what we see today, and should be understood in this light: Growth was mostly centred on the domestic market, and rapid growth in trade (from a low base) was mainly between developed economies.
Mass production, domestically based and advanced along Taylorist principles of scientific management of workflow, was ‘generalised’ to more features of the (domestic) work process and went hand-in-hand with massive mechanisation. The ability of this more closed regime of accumulation to return high rates of profits came to an end before the oil price shocks, indicating its inability to generate continuous productivity increases in the face of the evolving needs of capital. By the end of the period, industrial strife and distributional conflict were at a fever pitch, and the stage was set for the global spread of capital, though its benefits would be increasingly unequally distributed.
During this period, the Cold War created favourable conditions for the spread of US capital to the Asian Tigers and Western Europe. The US shared ideas, technology, expertise, aid, and capital to defend against the rise of communism. The Korean War and US military expenditures provided an additional stimulus for the region.
Taiwan began its export promotion and industrial planning in the early 1960s under the strong financial, political, and technical support of the US. South Korea followed suit in 1961. That same decade, Japan underwent an inexorable rise, becoming the second-largest economy under post-war industrial policies and the unique US occupation. Japanese GDP per capita almost tripled from $7,079 in 1960 to $20,962 in 1980, and the country became an essential source of capital and technology for South Korea and the region. Most importantly, it provided a culturally familiar economic model and source of expertise for regional states to draw on.
As city states, Hong Kong and Singapore – the other ‘Tigers’ – are better seen as regional entry points that became further integrated in their respective regions. Hong Kong’s transformation began in the 1950s and Singapore’s in the following decade. The countries pursued somewhat opposing development strategies, with Hong Kong adopting a more laissez-faire approach and Singapore’s business and social policies being state managed. Singapore’s access to world markets and entrepreneurial talent also occurred through a much more extensive reliance on multinational enterprises (MNEs). Today, Japan, South Korea, Singapore, and Taiwan are among the few countries that have more than 1% of their populations in the world’s richest 1%. Like Japan, the Tigers were all densely populated and without an abundance of natural resources. This is in notable contrast to other parts of Asia, as well as Africa and South America, which all have significantly lower population densities and are abundant in land and natural resources.
LAC countries were unable to take advantage of favourable global conditions to the same extent as the Asian Tigers. Their exports remained undiversified, despite the use of import substitution industrialisation (ISI) policies. Nonetheless, they still saw strong growth in GDP per capita, which almost doubled from $2,315 in 1960 to a peak of $4,325 in 1980, roughly in line with the growth of advanced economies.
Sub-Saharan Africa saw moderate growth in tandem with the commodity cycle and advanced economies. By the mid-1960s, most African countries had only just achieved independence and were dealing with the challenges of rebuilding their societies. African independence came at the height of the Cold War. This aggravated the fighting that arose with the transition from colonial rule. Sub-Saharan Africa’s GDP per capita grew from $707 in 1960 to a peak of $982 in 1974, before gradually declining to a low of $769 in 1994.
The pull of communism peaked during the Leonid Brezhnev era with rapid growth in the Soviet Union in 1964, before leading to stagflation in 1982. At its height, the Soviet Union seemed unstoppable. Leading US economists even predicted convergence with the US by as early as 1984 or as late as 1997.
Close by, China had not yet opened itself to the world. Its break with the USSR would be instrumental in pushing Mao Zedong, founder of the People’s Republic, to seek rapprochement with Washington, beginning with former US President Richard Nixon in 1971.
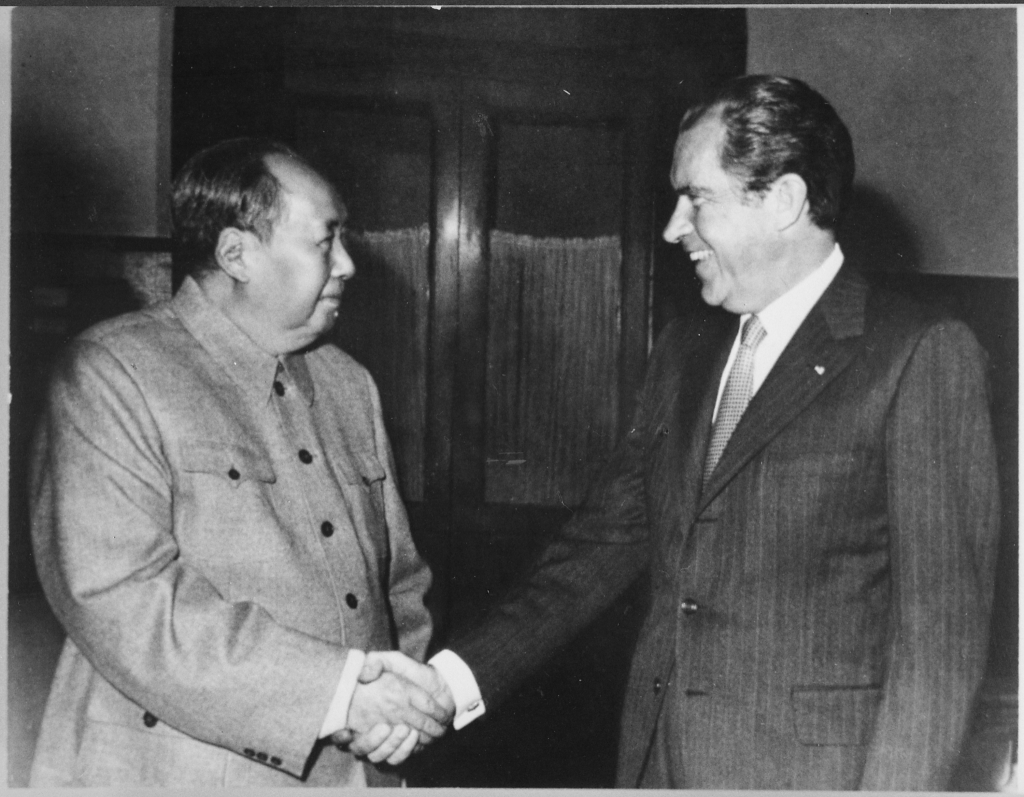
The February 1972 meeting between US President Richard Nixon (right) and Mao Zedong of China marked an important step in the normalisation of relations between the two countries. Wikimedia Commons
3.2. Capital unleashed: The spread of finance and debt
Stage II roughly began with the oil price shocks and stagflation of the 1970s, and ended with the fall of the USSR in 1991.
The world economy became increasingly globally integrated under a new free-floating exchange rate regime. Tariffs and other barriers to integration continued to be dismantled, allowing for a more international division of labour. Such integration led to a consistent expansion in trade and the beginning of a precipitous rise in FDI. According to World Bank data, world trade to GDP increased consistently from 30% in 1973 to 39% in 1990, while FDI increased from 0.5% of GDP in 1973 to 1% by 1989. Cross-border financial stocks held by foreign investors also increased dramatically (Figure 11), rising from 30% of world GDP in 1970 to 724% of world GDP by 2011. This created enormous opportunities for developing economies looking to increase their rates of growth, but also increased the risks of currency and debt crises.
Figure 11: Cross-border Stock Holdings of Select Financial Assets as a % of World GDP, 1970-2004
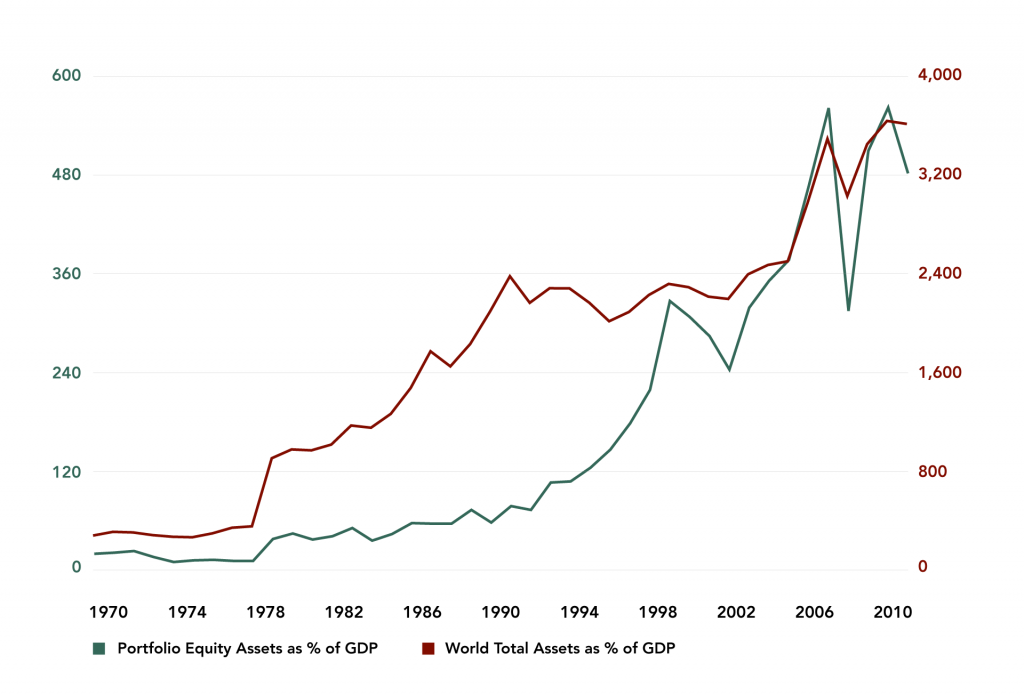
Source: IMF, 2006 and 2012
Note: Using 2006 US$m. World total assets include portfolio equity assets, FDI assets, debt assets (portfolio debt and other investment), financial derivatives, and total reserves minus gold.
Despite the greater availability of capital, global growth during this period was low and volatile. Global GDP growth was cut in half after 1973, and there was substantial divergence between regions. East Asia outperformed all other regions (excluding Japan): Its per capita growth was – unlike the rest of the world – faster after 1973 than in the Golden Age. This led to its near catch-up with the West. For Africa and LAC countries during this period, the end of the commodity cycle sparked a debt crisis, inflation, and significant fiscal and monetary problems. Large economic gains, however, continued in Mauritius, Thailand, Israel, Turkey, Chile, and Malaysia.
The post-war accommodation between capital and labour ended when, in response to rising inflation and unemployment, voters turned to the conservative policies of then US President Ronald Reagan and then British Prime Minister Margaret Thatcher. Conflict erupted over how the social surplus should be distributed in response to perceived attempts by Reagan and Thatcher to return the economy to a “pre-Keynesian era of dog-eat-dog capitalism”. Union rights were diminished, taxes were lowered, minimum wages stagnated, and social welfare was cut. The ultimate impact was increasedinequality as income was redistributed upward.
Rapidly increasing global integration underpinned by new technologies is ultimately what allowed for this more competitive capitalism to be ‘unleashed’. Higher taxes and wages became a cost that domestic firms could cut to try and ensure they could compete with foreign firms. Additionally, the fading Soviet threat influenced the West’s adoption of a harsher version of capitalism. In the end, the Soviet Union could not match the phenomenal social and economic advances inherent in new technology coupled with an international division of labour. The disadvantages of a purely domestic division of labour, using domestic technologies and ideas on the basis of a planned economy, proved devastating for the USSR.
The fixed dollar-gold monetary regime came to an end in 1971 when the US unilaterally terminated convertibility of the US dollar to gold, rendering the dollar a ‘fiat’ currency by 1973 and effectively making it the reserve currency of the world. Countries were consequently free to adopt floating exchange rates determined by market forces.
The most important impact of the monetary system transition was the inflation fuelled by its disbandment. Under the dollar-gold standard, there was initially a shortage of international liquidity, i.e. US dollars. To alleviate this shortage, the US exported capital and economic aid post-WWII. Later, the the US printed money to finance its growing deficit, in line with its domestic agenda. This led to the opposite problem of too many dollars and not enough gold to credibly fix it to. By 1970, inflationin the US had climbed to nearly 6%. Monetary and fiscal policy, however, remained expansionary; Nixon further forced down interest rates in an effort to raise popularity, fuelling monetary growth around the world. By 1980, inflation in the US had hit 13.5%.
To deal with the high inflation rate, Paul Volcker – as chairman of the Federal Reserve – raised the federal funds rate to 20% in June 1980. This dramatically increased borrowing costs for countries that, in the preceding years, had borrowed heavily under the easy monetary conditions and advances in financial markets. With the bottoming of the commodity cycle and slowing growth in advanced economies, a debt crisis ensued.6
The Friedman-Hayek explanation of the rising inflation was that the US economy had been overheated by excessive wage demands and unsustainable government spending on liberal programmes. The left argued that it was caused by two external shocks:
“The first was the unwillingness of [former US President] Lyndon Johnson to raise taxes in order to pay for the Vietnam War. The second came from the formation of the OPEC oil cartel, which raised world petroleum prices in three separate stages in the 1970s, triggering a dramatic rise in the cost of living.”
In Latin America, the Volcker interest rate ‘shock’ saw its dollar denominated flexible interest rate debt soar. The region’s economy contracted 2.7% in 1983 – almost double what resulted from the global financial crisis of 2009 – and a ‘lost decade’ ensued. While easy monetary conditions set the stage for the crisis, key Latin American economies, particularly Brazil and the Southern Cone countries, were already inflation prone, having strongly expanded fiscal deficits without raising taxes in the preceding years.7 Underlying the region’s difficulties was its continued dependence on commodity exports, which its ISI policies had ultimately failed to break.
Figure 12: Inflation Rate for Select Countries and Regions, 1960-2014 (%)
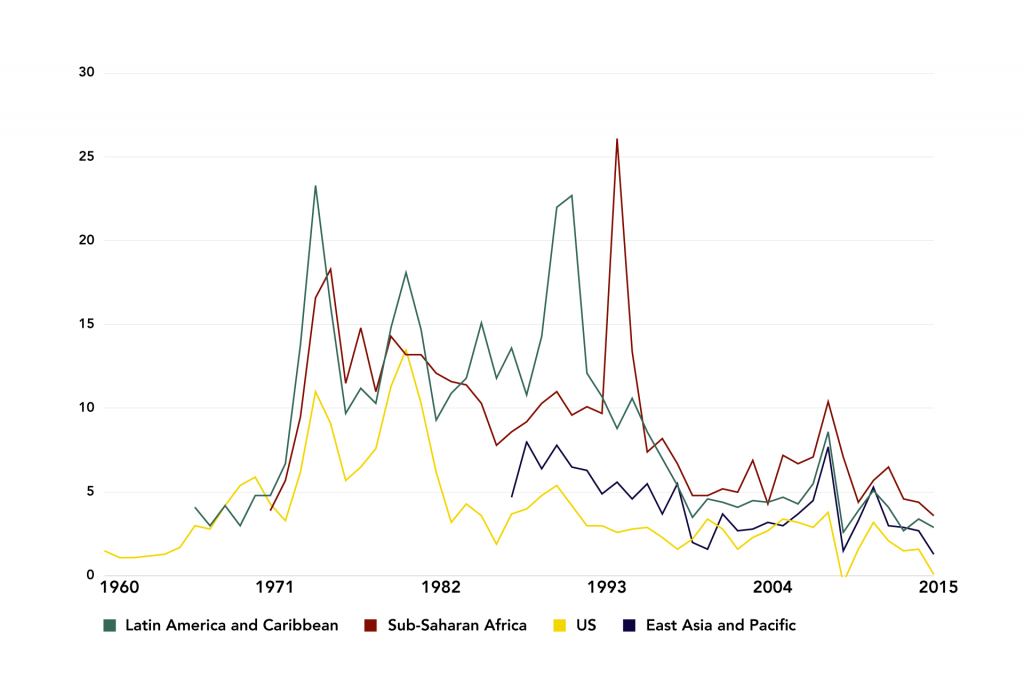
Source: The World Bank, 2015
While the debt crisis helped avert a banking disaster in the US, it resulted in ‘debt overhang’. Debt-write offs were finally included in the Brady Plan of 1989, which was designed to tackle the Latin American debt crisis of the 1980s in a more sustainable manner. Most LAC countries eventually pursued a neoliberal policy mix pioneered by Chile, but recovery was slow. Argentina’s GDP per capita was 15% lower in 2002 than in 1980, while Brazil’s GDP per capita only surpassed its 1980 peak in 1994.
Figure 13: Commodity Price Indexes for Energy and Non-energy, 1960-2015
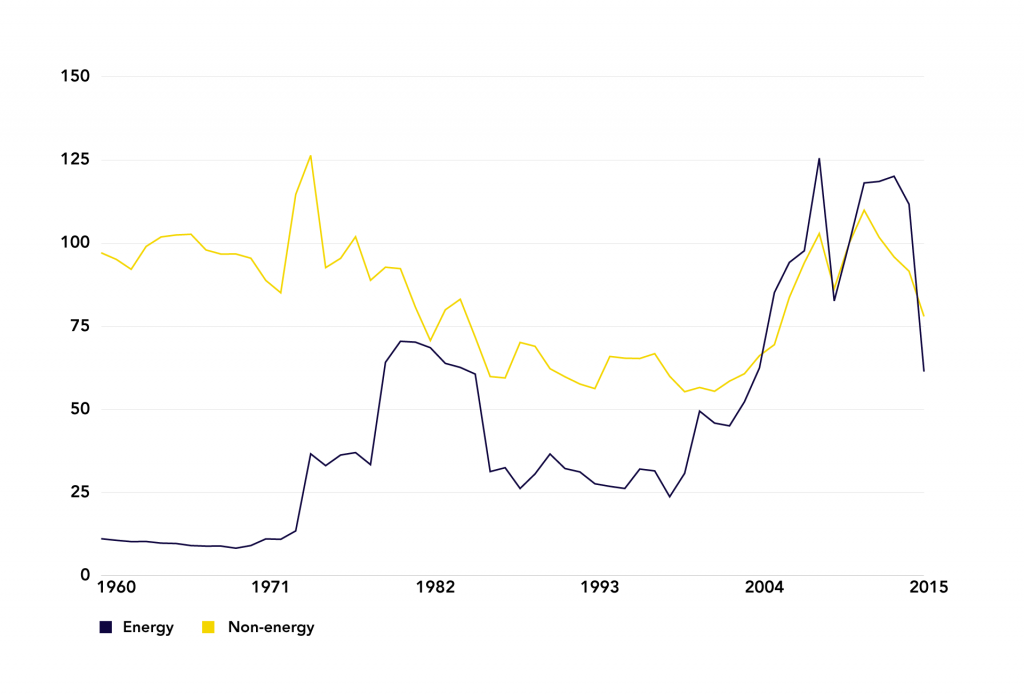
Source: The World Bank, 2015
Note: In 2005 US$, 2010 = 100.
African countries accumulated even larger debts than LAC countries on a per capita basis, amounting to 36% of GDP for sub-Saharan Africa.8 Lending increased to Africa during the Cold War rivalry, while the commodity price boom in the 1960s saw African governments increase their external borrowing dramatically and engage in often unproductive spending. However, when commodity prices dropped under slowing global growth, and when Cold War foreign aid fell under the reduced Soviet threat, sovereign borrowing did not slow. A severe drought worsened the situation.
Unlike with the Latin American debt crisis, much of Africa’s debt was owed to the IMF, which imposed controversial structural adjustment programmes on African governments in return for concessional lending. By 1990, even under reduced levels of debt service, debt still amounted to 28% of sub-Saharan Africa export earnings. For many African countries, per capita GDP levels stagnated for two decades (see section 2). In the process, Nigeria, for example, went from being classified by the World Bank as a middle-income country in 1978 to a low-income country by 1989.
Commodity dependence, boom-bust growth cycles, and poverty remain connected. Commodity prices are highly volatile and make an economy reliant on just a handful of goods for livelihoods and foreign exchange. Moreover, unless beneficiated substantially, commodities command low returns to the domestic producer. In 2012/13 two out of three developing countries, half of which were in Africa, were commodity dependent.9 From a total of 94 developing countries, 63 in 2012/13 were considered extremely commodity dependent, whereby commodities accounted for more than 80% of merchandise export earnings.
China’s gradual opening under Deng Xiaoping began after Mao’s death in 1976. Economic experiments started in Guangdong’s special economic zones in 1978 and soon spread to other coastal provinces. China drew carefully on the practical knowledge of Japan and other successful late industrialisers, including international experts. This helped transform the Communist Party of China into an effective vehicle for advancing modernisation. In stark contrast, the Soviet Union’s economy had come to a standstill by the time of Communist Party leader Brezhnev’s death in 1982. Instead, it was Japan that came to pose an economic ‘threat’ to the US, having overtaken the UK in GDP per capita.
3.3. The end of communism and the rise of ‘capitalist’ China
Stage III began in 1989 with the fall of the Berlin Wall and the drawing up of the Washington Consensus, and continues to the present.
Sources: Bayside Journal | Nathan Hughes Hamilton/Flickr CC BY 2.0 | Matthias Ripp/Flickr CC BY 2.0 | RCR Wireless News | The Economist | IMF | World Trade Organisation | World Bank | UN Conference on Trade and Development | BP | China Daily Europe | The Wall Street Journal | Huawei | Forbes | ZDNet | Angus Maddison historical data | World Bank | Shanghainese/Wikimedia Commons | Wikimedia Commons
Economic growth in emerging markets slowly picked up in the 1990s, becoming widespread the following decade with the rise of China. Emerging markets grew 6% per year from 2002 to 2012, their highest rate in any 10-year period over the past four decades. In 2012, South Asia even overtook sub-Saharan Africa in GDP per capita, further signalling the growing reverberations in Asia of China’s rise. The 2007-08 financial crisis – ultimately driven by growing global inequality and the subsequent inadequacy of effective demand – ushered in a period of low growth and economic austerity in the West. This coincided with internal adjustments in China’s maturing economy away from investment and heavy industry towards consumption and services. Together, these shifts have considerably lowered the growth prospects for the world and emerging markets for the foreseeable future.
In December 1991, Soviet Communism fell due to mounting pressure from the ‘battering ram’ of cheap capitalist goods. This integrated the once centrally planned economies of the Soviet Union and Eastern Europe – and their roughly 500m people – into the global economy. In 1991, peace accords were reached in Cambodia after the country had fallen to communism in 1975; while in 1994, the US lifted its embargo on Vietnam.
The decline of the Cold War saw the US shift its foreign engagements. Marxism and proxy wars retreated from Africa and LAC countries, helping to reduce civil wars and accelerate the shift towards democratic regimes. South Africa became a democracy in 1994 and Nigeria returned to democracy in 1999. Democracy was also re-established in Argentina, Brazil, and Chile in the 1980s. Preferential trade access to US markets was extended to eligible African countries in 2000 through the African Growth and Opportunity Act, a vital lifeline to manufacturing in Africa. Former US President George W. Bush’s Emergency Plan For AIDS Relief, established by the US in 2003 and extended in 2008, has saved more than 1m lives in Africa through the massive expansion of HIV/AIDS treatment. These and other interventions improved Africa’s ‘fundamentals’, arguably allowing for its decade of commodity-led growth to have a more long-lasting and positive effect on the wider population and economy.

Following a military regime that ruled Brazil from 1964-85, the 1985 elections ushered in a ‘new republic’ of civilian governance. Pictured above is the final parliamentary session of the 1988 Constitutional Congress that established the constitution of Brazil. Agencia Brasil/Wikimedia Commons CC BY 3.0 BR
Globalisation advanced at a phenomenal rate during this period: World trade to GDP increased from 39% in 1990 to 59% in 2014; and FDI increased from 1% of world GDP in 1989 to 2% in 2014, down from 5% in 2007. China continued its integration into world markets, despite a break between 1989 and 1992 following the Tiananmen massacre. India liberalised in 1991. The development of the world market went hand-in-hand with technological advances and the continued transformation of the multinational enterprise. This led to an increase in inequality and ‘financialisation’.10
The global business revolution in information and communication technology rapidly broke down the boundaries of the firm and helped it establish new levers to control increasingly dispersed and modular production. The decisions of a handful of MNEs, based on market forces, increasingly control the distribution of the world’s main supply chains and the terms by which production spreads to emerging markets.
The developing world eventually escaped most of its debt overhang, but not completely. While Latin America’s debt problems approached resolution by the beginning of the 1990s – barring Argentina’s cataclysmic default in 2002 and resulting investment drought – Africa’s worsened. The Heavily Indebted Poor Countries (HIPC) Initiative of 1996 required unrealistic levels of structural adjustment. Proper debt relief only began with the Enhanced HIPC Initiative of 1999, jointly administered by the World Bank and IMF, but still required structural adjustment. Debt relief was accelerated further in 2005 through the Multilateral Debt Relief Initiative.
Debt relief freed up vital resources for social spending in Africa. For the 36 countries receiving debt relief – 30 of which were African – debt service paid declined by about 1.8 percentage points of GDP between 2001 and 2014. Before the HIPC Initiative, eligible countries were, on average, spending slightly more on debt service than on health and education combined. Such social spending is now about five times more than debt service payments.
In East Asia, the financial crisis of 1997 temporarily reversed the fortunes of most countries in the region and precipitated global imbalances in foreign exchange reserves. This helped advance easy monetary conditions in the US, making borrowing cheap globally and pushing investors to take more risks. This temporarily raised emerging market growth rate possibilities as they received more capital inflows.
In the aftermath of the collapse of its asset price bubble in 1991, Japan became mired in deflation. It took 15 years for its GDP to recover to 1995 levels, in current US dollar terms.
In 1991, the USSR collapsed and broke up into 15 states, 11 of which maintain loose political links with Russia. ‘Shock therapy’ in Russia saw its GDP shrink 46% between 1990 and 1998. Subsequently, high energy prices drove rapid growth and allowed the country to pay off its large debts. The three Baltic states of Estonia, Latvia, and Lithuania, as well as the Czech Republic, Slovakia, Hungary, and Poland joined the EU and NATO. On the whole, the 15 successor states of the USSR have performed exceptionally poorly relative to other emerging markets. According to the late British economist Angus Maddison: “The east European countries which were [only] formerly part of the Soviet bloc have done much better, but their average performance in per capita terms lagged behind western Europe except for Poland and Slovenia.” Slovenia even overtook South Korea in per capita GDP for a period before the 2007 financial crisis.
In contrast to the Soviet Union, China’s state-owned economy took a gradual and much more successful path to market reform, overtaking the US in 2014 as the world’s largest economy in PPP terms. Together, the US and China account for about one-third of world GDP, making their joint stability increasingly important to the global economic architecture.
Much of China’s demand has been in commodities, leading to a commodity ‘super cycle’ that has been central in propelling emerging market growth since 2001. According to the Financial Times:
“China grew from consuming about 12% of the world’s metals in 2000 to near 50% today. In commodities like iron ore, between 1998 through 2008, China’s total demand rose more than five times. In steel, China grew to consume more than the US, Russia, India, Japan, and Korea combined, and has also been a key driver of oil demand growth in the past decade.”
In agricultural commodities, however, its growth has been in line with the world’s. China is now also Africa’s main trading partner and the second-largest partner for Latin America as a whole, as well as the largest for Brazil and other LAC countries.
In 1991, India began to liberalise its economy, with its growth and FDI inflows picking up considerably around 1994. However, it remains uncertain whether the country can realise growth rates comparable to China given its highly decentralised political system. India ranks 130 out of 189 in the World Bank’s ‘Ease of Doing Business’ index, 46 places behind China. In addition, unlike China, India’s ruling classes have not invested in social or physical infrastructure.

Part IV - Looking Forward: Prospects for ‘the Rest’
Will the rise of ‘the rest’ continue and become more widespread? Legitimate reasons for doubt exist:
- The end of the commodity cycle has slowed growth to a trickle for most emerging markets, two-thirds of which are commodity dependent. These economies lack a relevant development model. Unlike the Asian Tigers, today’s underdeveloped economies are largely commodity rich and less densely populated.
- The assimilation of new ideas and technology is constrained by the WTO. A growing multipolar world might also make advanced countries more hesitant to share advanced technologies, at least initially. This may change as global leaders compete for influence.
- Growing global integration has complicated development strategies in at least three ways:
First, MNEs have become harder to discipline and extract benefits from. The state’s ability in the past to discipline capital, be its exclusive source of resources and incentives, and restrict its movement abroad helped align the interests of corporations with ‘their’ state. This underwrote the East Asian development model. As MNEs have become more global, the benefits they can provide through jobs and investment are increasingly disconnected from their country of origin.
Second, as capital has become more footloose it has become increasingly difficult to extract corporate tax revenue, which developing economies rely on for public investments. Minimum work standards and wages have also become more difficult to enforce solely at the national level.
Third, market-led globalisation has facilitated a growing divergence within countries. This is making convergence between countries less meaningful and more precarious. Emerging markets need large middle classes to foster stability and drive essential public investments. Instead, according to inequality expert Branko Milanovic, 44% of the absolute (i.e. total) gains in global income over the past two decades went to the richest 5% of the world’s population, with the top 1% receiving 19% of the total increase in global income during the period 1988-2008. Milanovic notes:
“In contrast, people whom we have termed the main beneficiaries of the current era of globalisation, the ‘emerging global middle class’ have only received (by ventile [groups of 5% of the population]) between 2% and 4% of the increase in the global pie, or in total about 12-13%.”
- Technology may reduce employment prospects as production becomes more machine intensive. This may also make it more difficult for countries to develop a middle class.
- A new orientation for China under President Xi Jinping may reduce growth and increase inter-state competition, thereby increasing global risks and lowering global growth.
There are also important reasons to be hopeful:
- Demographic trends favour emerging markets: In 2015, the more developed regions of the world accounted for only 17% of the global population.11 By 2050, this figure is expected to fall to 13%. Less-developed regions will, in turn, see their prospective market size grow in relative terms, thereby potentially attracting more consumer-seeking investments.12 Demography, however, is not destiny and is also not always an unmitigated good.

By 2030, Manila is projected to be the second-largest city in the world after Tokyo. February 10, 2009. SciDevNet/Flickr CC BY 2.0
- Foreign technology remains a potent enabling force for catch-up: Despite efforts to make it excludable, technology spreads and can be assimilated, bought, backward-engineered, and learnt through enrollment at overseas universities.
The mobility of labour and knowledge are profound forces working against the pre-existing advantages held by advanced nations. For example, in one particular MIT graduate class, roughly half of the 30 students majoring in shipbuilding were Korean. This helped Korea become a world leader in the field. With the IT revolution, cutting-edge knowledge transfer can take place today for free online. Despite this, modern services and intangible assets play a large role in extendingthe relative advantages of advanced nations.
- China’s continued rise: China is not yet a mature economy and will continue to grow strongly. The country acts as a political and economic counterweight to the US, thereby increasing competition in economic and political spheres. Its economic actors are less risk averse and are unconditional in their economic engagements – characteristics that have enormously benefitted emerging markets until now, despite the dramatic reallocation of global light manufacturing.
The growing rivalry between the US and China will be an important force in shaping, and potentially undermining, emerging market growth. This is of considerable importance given that increasing global co-operation is required if catch-up is to become more widespread. Inter-state co-operation is vital in helping to manage volatility in global commodity markets and ensuring countries can reap the full benefits from MNEs.


